How We Built the Loan Comparison Calculator with D3 Math + React Components (And You Can Too)
We all love it when the internet gives us stuff to play withWhen we built our Loan Comparison Calculator, we knew it had to have a juicy data visualization component as its centerpiece. Without an interactive data viz, your calculator is dry, dull, and unfriendly - you may as well be serving crusts of bread and cups of lukewarm water to your website’s visitors. They probably won’t want to stick around to find out more about your awesome product with that kind of experience. How can you lay out a better spread to entice more folks to sample your wares?
In our case, we knew our homeowners desired a way to compare loans quickly and easily in order to choose the best one for their circumstances. Balancing between points / credits and interest rate is tricky business, and we wanted to provide a tool to help uncomplicate that decision.
Lucky for everyone, there are two excellent JS libraries available to help take any crusty, bewildering experience and turn it around. You may have heard of them: D3 and React; together, they are as wonderful a combo as peanut butter and chocolate. In fact, I hope you are more than passingly familiar with both libraries, as the techniques outlined in this tutorial speak to a somewhat more advanced use case.
So, to the end of helping to make data more fun across the internet, and enhancing your individual skills as a UI developer, this tutorial will demonstrate how to:
RECONCILE the two (polarizing) approaches D3 and React take to DOM manipulation. Spoiler alert, it's imperative vs declarative, respectively.
BUILD reusable components to accelerate production of calculators, graphs, maps, and all kinds of other data viz widgets.
ORGANIZE your code so it is consistent and easy to maintain.
If you've stayed with me this far, here's what you can expect to get from this tutorial:

The Tools
D3 (Data-Driven Documents) is a JavaScript library that provides beaucoup methods for generating, updating, and animating dynamic web-based data visualizations. It manipulates the DOM via imperative programming patterns:
const element = d3.select("#my-element") element .attr("class", "first-class") .append("rect") .attr("width", 920) .attr("height", 460)
React is also a JavaScript library, and it too provides beaucoup methods for rendering and updating web UIs based on visitors’ interactions. It favors functional programming design patterns - your functional components directly return the HTML and associated listeners to build your page.
const ReactComponent = () => <div>React + D3 = ❤️
With the advent of hooks, React’s state management mechanism also moved in a much more functional, declarative direction. Now, instead of calling setState to update the UI, you wire up hooks to watch changes on specific pieces of state and re-render the bits of the UI that are dependent on those pieces.
Bear with me, all will become clear (hopefully)!
The Reconciliation
D3 and React both provide methods for keeping your UI alive and responsive. Unfortunately, in terms of how it is done, these libraries contradict each other. There are a couple ways to harmonize the two:
- Let D3 Handle DOM Mutatations and Let React Handle State
D3 gives us a handy, jQuery-esque API for changing the DOM. If we give D3 access to the elements of our React components via the React ref object, we can allow D3 to handle updates that happen in our React state. Using hooks, we can set up a nice partnership between the two:
useEffect(() => {
 const rectangles = d3.select(svgRef.current).selectAll('rect')
 rectangles.data(data);
 return () => rectangles.remove();
}, [data]);
As you might imagine, however, code that mixes paradigms can become unwieldy. It runs the risks of giving yourself or your colleagues headaches and feelings of sadness as the code becomes divided and argumentative. Plus, let’s face it, imperatively changing the DOM is just soooo 2020.
- Let React Handle State and the DOM, Let D3 Handle the Mathematics
This approach is more advanced, as it requires some knowledge about how D3 works under the hood. The pay-off, however, is sweet. We are able to ditch the imperative-y style of D3 selects in favor of working almost exclusively with functions. And functions, as we all know, are fun! In the next section, I’ll work step-by-step to show how we used this technique to create the graph in our Loan Comparison Calculator.
Step-by-Step
Let’s look at the outline for what we will need to do in order to get our interactive data visualization humming:
- Get your data
- Scale your data
- Graph your data
- Give your data life
Let’s jump right into it - I’ll assume you are starting with a fresh create-react-apps TypeScript project.
Step 1: Get your Data
To keep things simple, we will use Math.random to generate our data. We will create an array of random numbers like so:
// STEP 1: Get your Data
const DISTRIBUTION_MAX = 100000;
const X_MAX = 100;

const data = Array.from(Array(X_MAX)).map(
  (d) => Math.random() * DISTRIBUTION_MAX
);
Here we are creating an array of 100 random numbers between 0 and 100000 (the max of our distribution).
Your data may be in csv, json, xml format, or requested from a backend source, but a random collection of numbers will suffice for this purpose.
Scale your Data
The next step is to scale our data to fit in the SVG element where we will draw our graph. Again, for this tutorial we will simplify the process, and simply assign static dimensions to that element. Your project’s scales will probably need to react to the dimensions of the SVG - in that case, you will need to grab a ref to the SVG element and use that to obtain its dimensions when the browser window resizes, or as a result of some other event.
Since we are creating a basic line chart, we will use the scaleLinear method from the d3-scale standalone library. scaleLinear, like all d3-scales, maps a set of input values (the domain) to a set of output values (the range); in this case, the domain is the min/max of our random numbers array, and the range is the height of our SVG.
Using our scaling functions, we can create an array of scaled data points scaled to our SVG like so:
// STEP 2
const SVG_HEIGHT_AND_WIDTH = 400;
const MARGIN_LEFT = 40;
const xScale = scaleLinear()
.domain([0, X_MAX])
.range([MARGIN_LEFT, SVG_HEIGHT_AND_WIDTH]);
const yScale = scaleLinear()
.domain(extent(data) as number[])
.range([SVG_HEIGHT_AND_WIDTH, MARGIN_LEFT]);

const scaledData = data.map((d, i) => ({ x: xScale(i), y: yScale(d) }));
If you are wondering why the range of the yScale is [SVG_HEIGHT_AND_WIDTH, MARGIN_LEFT], it’s because the browser locates the origin (0,0) point of an SVG element in the upper left hand corner.
Now that we have our mise en place, we can get cooking with our graph!
Step 3: Graph your Data
The first thing we want to do is generate the SVG instructions for drawing a line. The D3 standalone library d3-shape provides us with the line method which does just that. Line will return a string containing a series of path commands that define the path to be drawn, which we will assign to the d property of our path element.
While we are at it, let’s throw in a line for the x-axis and a line for the y-axis:
// STEP 3: Graph your Data

const graphedLine = line()(scaledData) as string;
const xAxis = line()(
 data.map((d, i) => [xScale(i), SVG_HEIGHT_AND_WIDTH])
) as string;
const yAxis = line()(data.map((d) => [MARGIN, yScale(d)])) as string;
function App() {
 return (
   <>
     <h2 style={{ marginLeft: `${MARGIN}px` }}>That Graph Tho</h2>
     <svg height={SVG_HEIGHT_AND_WIDTH} width={SVG_HEIGHT_AND_WIDTH}>
       <path d={graphedLine} className="line"></path>
       <path d={xAxis} className="xAxis"></path>
       <path d={yAxis} className="yAxis"></path>
     </svg>
   </>
 );
}
In comparison, if we were using d3 select, our code would resemble this snippet:
// Just the line for the data points, without the axes

const linePath = line()(scaledData);

const svgContainer = d3.select('body').append('svg').attr('width', SVG_HEIGHT_AND_WIDTH).attr('height', SVG_HEIGHT_AND_WIDTH);

const lineGraph = svgContainer
  .append('path')
  .attr('d', linePath)
  .attr('strok', 'red')
  .attr('fill', 'none')
  .attr('strok-width', 2);
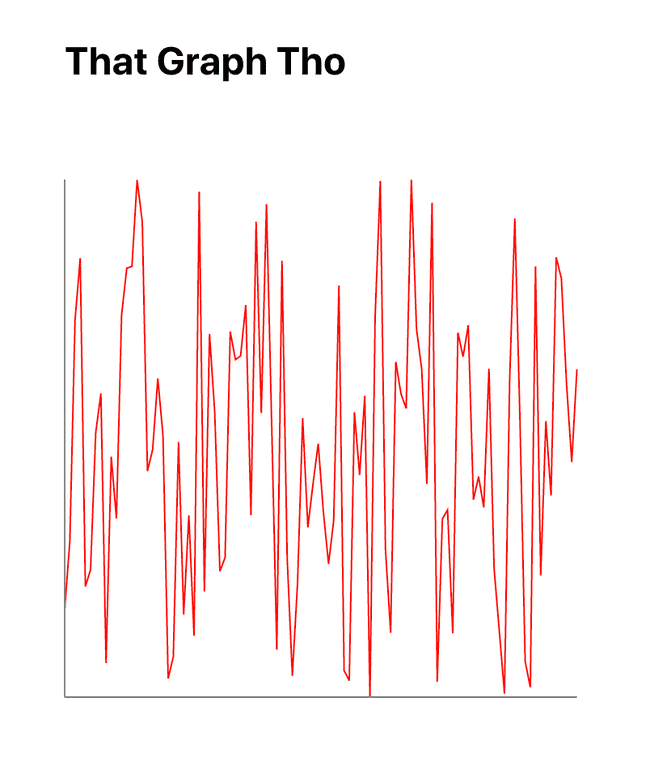
We should now have this masterpiece rendered:
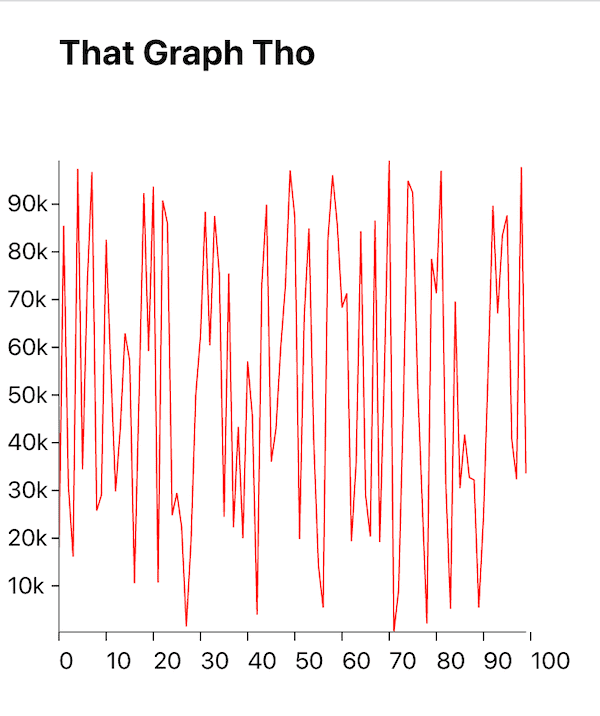
Let’s improve it a little with some informative tick marks along our axes:
const xTicks = xScale.ticks(10);
const yTicks = yScale.ticks(10);

const yTickFormatter = format(".2s");

<svg height={SVG_HEIGHT_AND_WIDTH} width={SVG_HEIGHT_AND_WIDTH}>
       <path d={graphedLine} className="line"></path>
       <path d={xAxis} className="xAxis"></path>
       <path d={yAxis} className="yAxis"></path>
       {xTicks.map((tick) => {
         return (
           <g
             transform={`translate(${xScale(tick)}, ${GRAPH_HEIGHT})`}
             key={tick}
           >
             <line stroke="currentColor" y2="6"></line>
             <text fill="currentColor" y="25">
               {tick}
             </text>
           </g>
         );
       })}
       {yTicks.map((tick) => {
         return (
           <g
             transform={`translate(${MARGIN - 30}, ${yScale(tick)})`}
             key={tick}
           >
             <line
               stroke="currentColor"
               x2="5"
               transform={`translate(25, 0)`}
             ></line>
             <text fill="currentColor" x="-5" dy=".32em">
               {yTickFormatter(tick)}
             </text>
           </g>
         );
       })}
     </svg>
Step 4: Give your Data Life
At last! We are ready to give our graph some interactivity. Let’s wire up a listener so that when your curious visitor moves their cursor over the graph, we show a circle and tooltip to provide details on the underlying data point.
For this step, we will be using the pointer method from the d3 standalone library d3-selection. This method takes a mouse event as a first argument and returns an array of x, y values that indicate the mouse’s position relative to the moused element.
Once we have the coordinates, we’ll use the d3 bisect method to find where the mouse coordinates intersect with our scaled data. Recall, our scaled data maps our random data set to the SVG space we have set for our graph.
Finally, we will change the state to render the updated data point in the DOM. We’ll apply a formatter to the data point so we show a fixed number up to three places after the decimal.
// STEP 4: Give your Data Life
 const firstScaledDataPoint = scaledData[0];
 const [[scaledDataX, scaledDataY], setScaledDataPoint] = useState<
   [number, number]
 >([firstScaledDataPoint[0], firstScaledDataPoint[1]]);
 const [dataPoint, setDataPoint] = useState<number>(data[0]);
 const tooltipTextRef = useRef<SVGTextElement>(null);
 const [tooltipWidth, setTooltipWidth] = useState<number>(0);
const dataFormatter = format(".3f");

 useEffect(() => {
   if (tooltipTextRef.current) {
     const textWidth = tooltipTextRef.current.getComputedTextLength();
     setTooltipWidth(textWidth + 10);
   }
 }, [dataPoint]);
 return (
   <>
     <h2 style={{ marginLeft: `${MARGIN}px` }}>That Graph Tho</h2>

     <svg
       height={SVG_HEIGHT_AND_WIDTH}
       width={SVG_HEIGHT_AND_WIDTH + MARGIN}
       onMouseMove={(e) => {
         const point = pointer(e);
         const dataPointIndex = bisect(scaledData, point[0]);
         setScaledDataPoint(
           scaledData[dataPointIndex] || scaledData[scaledData.length - 1]
         );
         const validDataPoint = data[dataPointIndex];
         const dataPointToRender = validDataPoint
           ? validDataPoint
           : data[data.length - 1];
         setDataPoint(dataPointToRender);
       }}
     >
       <path d={graphedLine} className="line"></path>
       <path d={xAxis} className="xAxis"></path>
       <path d={yAxis} className="yAxis"></path>
       <circle
         r="5"
         transform={`translate(${scaledDataX}, ${scaledDataY})`}
       ></circle>

       {/* Tick elements go here. In SVG, elements are rendered based on order in the document.
       We want the tooltip to show up over the ticks, so we place it after them. */}

       <g transform={`translate(${scaledDataX}, ${scaledDataY})`}>
         <rect
           x="2"
           y="2"
           width={tooltipWidth}
           height="24"
           fill="black"
           opacity="0.4"
           rx="2"
           ry="2"
         />
         <rect width={tooltipWidth} height="24" fill="white" rx="2" ry="2" />
         <text x="4" y="16" ref={tooltipTextRef}>
           {dataFormatter(dataPoint)}
         </text>
       </g>
     </svg>
   </>
 );

Conclusion
Although this graph is a long way from the complexity involved in our Loan Comparison Calculator, it’s a solid starter recipe for whipping up your own data viz goodness. D3 + React is really a match made in the stars, since they are both libraries that essentially cultivate functional, declarative programming patterns. There’s a lot of math involved in obtaining a mortgage, and we at Better aim to make those dry abstractions as fun, generous, and helpful as we all aim to be.

Our thinking
The Growth team did what to the website??
And you won’t believe the results!Fri Oct 02 2020—by Koty Wong5 min readThe Tech and Team Behind a Better Homeownership Experience
Mortgages that are fast, flexible, and fair. A simple goal with some serious tech behind it. Today, Engineering Manager Abhi Reddy shares how his team is helping to reinvent the homeownership industry.Wed Jul 07 2021—by Abhi Reddy2 min read- tech team
- mortgage
Tackling Conversion With Survival Models And Neural Networks
At Better, we have spent a lot of effort modeling conversion rates using Kaplan-Meier and gamma distributions. We recently released convoys, a Python package to fit these models.Thu Aug 26 2021—by Marshal Bratten, Jesse Lax, and Stephen Ma3 min read

